1. Use Microsoft Excel to manage data & create basic data visualization
2. Create bar, line, and pie charts accurately in Adobe Illustrator from Excel Data
3. Import Adobe Illustrator file to Adobe After Effects for Animation
4. Utilize keyframe, masking, opacity, and shape objects to create advanced motion graphics
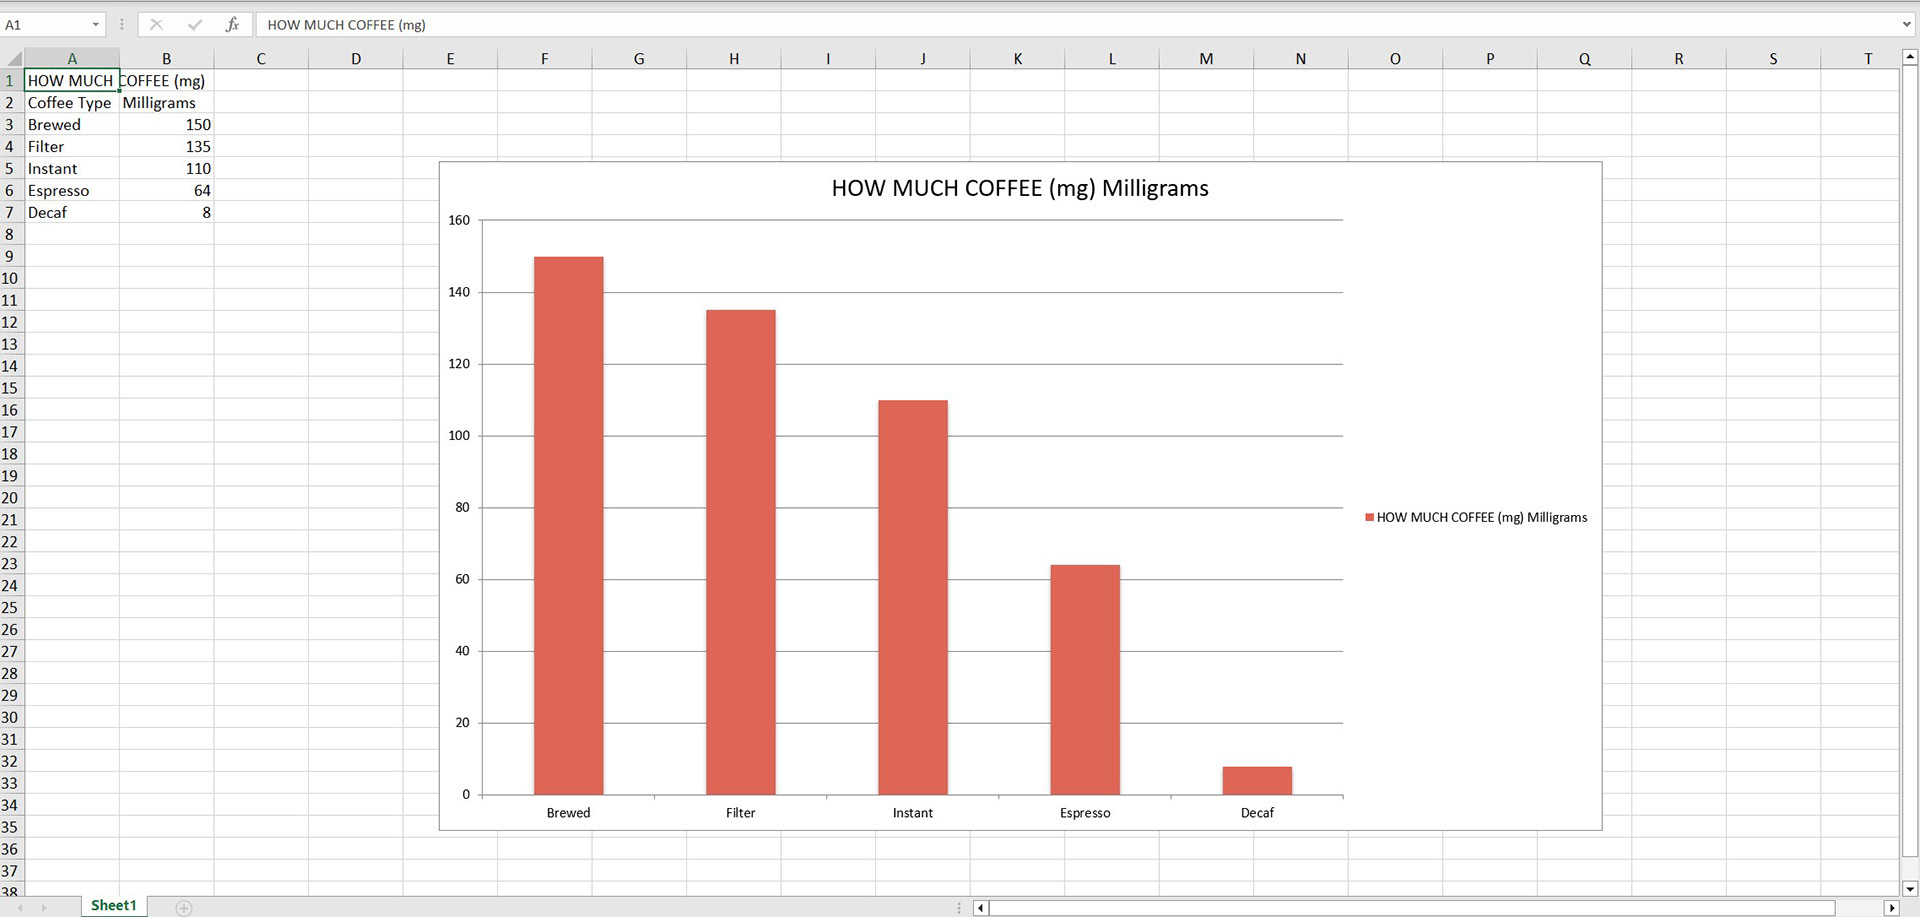
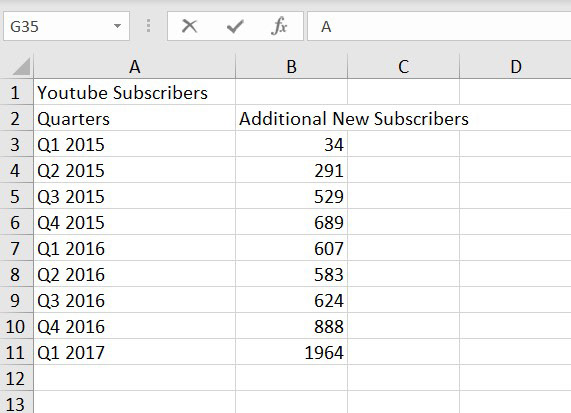
Excel to Data Visualization


Filling up an object


Camera & Tracking

Opacity & Masking